
Simple example#
The example below shows how to create a custom eye model from clinical parameters, build it in OpticStudio, and interact with the model.
Import visisipy and other dependencies#
import matplotlib.pyplot as plt
import seaborn as sns

import visisipy
Matplotlib is building the font cache; this may take a moment.
---------------------------------------------------------------------------
KeyboardInterrupt                         Traceback (most recent call last)
Cell In[1], line 4
      1 import matplotlib.pyplot as plt
      2 import seaborn as sns
----> 4 import visisipy

File ~/checkouts/readthedocs.org/user_builds/visisipy/checkouts/latest/visisipy/__init__.py:8
      5 import platform
      6 from importlib.metadata import version
----> 8 from visisipy import analysis, models, optiland, plots, refraction, wavefront
      9 from visisipy._zospy_loader import install_zospy_loader
     10 from visisipy.backend import get_backend, get_optic, get_oss, load_model, save_model, set_backend, update_settings

File ~/checkouts/readthedocs.org/user_builds/visisipy/checkouts/latest/visisipy/optiland/__init__.py:5
      1 """Analyze optical eye models in Optiland."""
      3 from __future__ import annotations
----> 5 from visisipy.optiland.backend import OptilandBackend
      6 from visisipy.optiland.models import OptilandEye
      8 __all__ = ("OptilandBackend", "OptilandEye")

File ~/checkouts/readthedocs.org/user_builds/visisipy/checkouts/latest/visisipy/optiland/backend.py:22
     13 from optiland.optic import Optic
     15 from visisipy.backend import (
     16     DEFAULT_BACKEND_SETTINGS,
     17     BackendAccessError,
   (...)     20     Unpack,
     21 )
---> 22 from visisipy.optiland.analysis import OptilandAnalysisRegistry
     23 from visisipy.optiland.models import OptilandEye
     25 if TYPE_CHECKING:

File ~/checkouts/readthedocs.org/user_builds/visisipy/checkouts/latest/visisipy/optiland/analysis/__init__.py:9
      7 from visisipy.backend import BaseAnalysisRegistry, _AnalysisMethod
      8 from visisipy.optiland.analysis.cardinal_points import cardinal_points
----> 9 from visisipy.optiland.analysis.mtf import fft_mtf
     10 from visisipy.optiland.analysis.psf import fft_psf, huygens_psf, strehl_ratio
     11 from visisipy.optiland.analysis.raytrace import raytrace

File ~/checkouts/readthedocs.org/user_builds/visisipy/checkouts/latest/visisipy/optiland/analysis/mtf.py:8
      5 from typing import TYPE_CHECKING, Literal
      7 from optiland.backend import to_numpy
----> 8 from optiland.mtf import FFTMTF, ScalarFFTMTF, VectorialFFTMTF
      9 from pandas import Series
     11 from visisipy.analysis.mtf import MTFResult, SingleMTFResult

File ~/checkouts/readthedocs.org/user_builds/visisipy/envs/latest/lib/python3.13/site-packages/optiland/mtf/__init__.py:11
      1 """Modulation Transfer Function (MTF) subpackage.
      2
      3 This subpackage provides classes for calculating the MTF of optical systems
   (...)      6 Kramer Harrison, 2025
      7 """
      9 from __future__ import annotations
---> 11 from .fft import FFTMTF, ScalarFFTMTF
     12 from .geometric import GeometricMTF
     13 from .huygens_fresnel import HuygensMTF, ScalarHuygensMTF, VectorialHuygensMTF

File ~/checkouts/readthedocs.org/user_builds/visisipy/envs/latest/lib/python3.13/site-packages/optiland/mtf/fft.py:13
     10 from __future__ import annotations
     12 import optiland.backend as be
---> 13 from optiland.psf.fft import ScalarFFTPSF, calculate_grid_size
     14 from optiland.utils import get_working_FNO
     16 from .base import BaseMTF

File ~/checkouts/readthedocs.org/user_builds/visisipy/envs/latest/lib/python3.13/site-packages/optiland/psf/__init__.py:6
      4 from .vectorial_fft import VectorialFFTPSF
      5 from .mmdft import MMDFTPSF
----> 6 from .huygens_fresnel import HuygensPSF, ScalarHuygensPSF
      7 from .vectorial_huygens import VectorialHuygensPSF

File ~/checkouts/readthedocs.org/user_builds/visisipy/envs/latest/lib/python3.13/site-packages/optiland/psf/huygens_fresnel.py:27
     22 from optiland.psf.base import BasePSF
     23 from optiland.psf.huygens_fresnel_strategies import (
     24     NumbaSummation,
     25     TorchSummation,
     26 )
---> 27 from optiland.visualization.system.utils import transform
     28 from optiland.wavefront import Wavefront
     31 class ScalarHuygensPSF(BasePSF):

File ~/checkouts/readthedocs.org/user_builds/visisipy/envs/latest/lib/python3.13/site-packages/optiland/visualization/__init__.py:9
      7 from .analysis import SurfaceSagViewer
      8 from .info import LensInfoViewer
----> 9 from .system import OpticViewer, OpticViewer3D

File ~/checkouts/readthedocs.org/user_builds/visisipy/envs/latest/lib/python3.13/site-packages/optiland/visualization/system/__init__.py:8
      1 """System visualization package for Optiland.
      2
      3 Kramer Harrison, 2025
      4 """
      6 from __future__ import annotations
----> 8 from .optic_viewer import OpticViewer
      9 from .optic_viewer_3d import OpticViewer3D
     11 __all__ = ["OpticViewer", "OpticViewer3D"]

File ~/checkouts/readthedocs.org/user_builds/visisipy/envs/latest/lib/python3.13/site-packages/optiland/visualization/system/optic_viewer.py:18
     15 import matplotlib.pyplot as plt
     17 from optiland.visualization.base import BaseViewer
---> 18 from optiland.visualization.system.interaction import InteractionManager
     19 from optiland.visualization.system.rays import Rays2D
     20 from optiland.visualization.system.system import OpticalSystem

File ~/checkouts/readthedocs.org/user_builds/visisipy/envs/latest/lib/python3.13/site-packages/optiland/visualization/system/interaction.py:14
     11 from threading import Timer
     13 from optiland.visualization.info.providers import INFO_PROVIDER_REGISTRY
---> 14 from optiland.visualization.system.lens import Lens2D
     15 from optiland.visualization.system.surface import Surface2D
     18 class InteractionManager:

File ~/checkouts/readthedocs.org/user_builds/visisipy/envs/latest/lib/python3.13/site-packages/optiland/visualization/system/lens.py:12
     10 import matplotlib.pyplot as plt
     11 import numpy as np
---> 12 import vtk
     13 from matplotlib.patches import Polygon
     15 import optiland.backend as be

File ~/checkouts/readthedocs.org/user_builds/visisipy/envs/latest/lib/python3.13/site-packages/vtk.py:58
     56 from vtkmodules.vtkRenderingLabel import *
     57 from vtkmodules.vtkRenderingLOD import *
---> 58 from vtkmodules.vtkRenderingLICOpenGL2 import *
     59 from vtkmodules.vtkRenderingImage import *
     60 from vtkmodules.vtkRenderingGridAxes import *

KeyboardInterrupt:
# Use the open-source Optiland backend for calculations; to use OpticStudio, replace
# "optiland" with "opticstudio"
visisipy.set_backend("optiland")
Define and build the eye model#
Yes, it’s only two lines of code!
# Initialize the default Navarro model
model = visisipy.EyeModel()

# Build the model in OpticStudio
model.build()
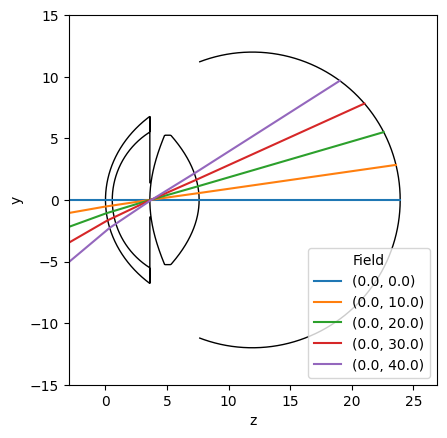
Perform a raytrace analysis#
# List of (x, y) coordinates
coordinates = [(0, 0), (0, 10), (0, 20), (0, 30), (0, 40)]
raytrace = visisipy.analysis.raytrace(coordinates=coordinates)

# Alternatively, the model can be built and analyzed in one go:
# raytrace = visisipy.analysis.raytrace(model, coordinates=zip([0] * 5, range(0, 60, 10)))
Visualize the eye model and the raytrace results#
fig, ax = plt.subplots()
visisipy.plots.plot_eye(ax, model.geometry, lens_edge_thickness=0.5)

sns.lineplot(raytrace, x="z", y="y", hue="field", ax=ax)
sns.move_legend(ax, loc="lower right", title="Field")